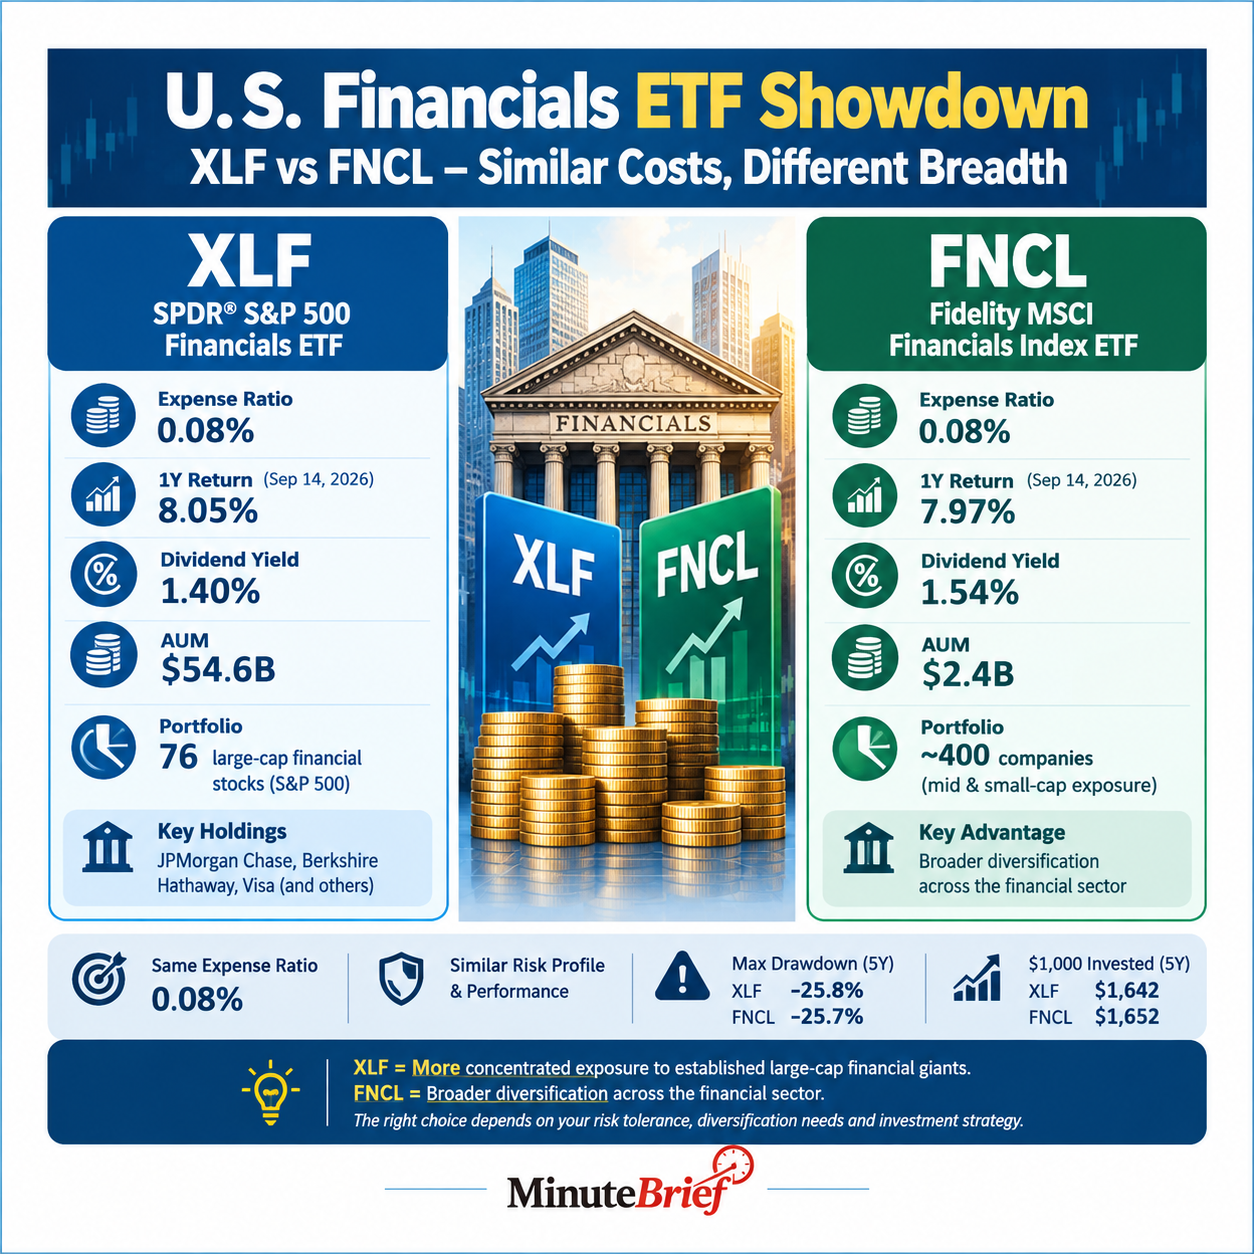
The State Street Financial Select Sector SPDR ETF (XLF) and Fidelity MSCI Financials Index ETF (FNCL) are notable, low-cost options for investors seeking exposure to U.S. financial companies, including banks, insurers, and capital-markets firms. Both ETFs have an identical expense ratio of 0.08% and offer similar risk and performance profiles. As of September 14, 2026, FNCL delivered a 1-year return of 7.97%, a dividend yield of 1.54%, and managed $2.4 billion in assets under management (AUM). In comparison, XLF posted an 8.05% return, a 1.40% dividend yield, and held $54.6 billion in AUM.
The primary distinction lies in their portfolio breadth. XLF tracks the Financial Select Sector Index and includes 76 large-cap financial stocks from the S&P 500, such as JPMorgan Chase, Berkshire Hathaway, and Visa. FNCL tracks the MSCI USA IMI Financials 25/50 Index and holds approximately 400 companies, providing greater exposure to mid- and small-cap financial firms. Over the past five years, their maximum drawdowns were nearly identical, with XLF at -25.8% and FNCL at -25.7%.
A $1,000 investment made five years ago would have grown to $1,642 with XLF and $1,652 with FNCL. In summary, XLF offers more concentrated exposure to established large-cap financial giants, while FNCL provides broader diversification across the financial sector. Investors should consider their risk tolerance, desired diversification, and investment strategy when choosing between the two ETFs.